Spectra
AI-powered BI
Ask questions about your data in plain English.
Get queries, visualizations, and dashboards.
No-frills business intelligence.
Connect your data. Ask a question. Get an answer. That's it. No training, no consultants, no six-figure contracts.
Ask, get answers
Type a question in plain English. The AI writes the query, runs it, and builds a visualization. Follow up to refine.
Build dashboards in minutes
Pin visualizations to a drag-and-drop grid. Add filters. Share with your team or via public link. Done.
Bring your own data
PostgreSQL, Snowflake, BigQuery — or just drop a CSV. Connect SaaS tools like Stripe and HubSpot. No migration.
Works with your stack.
Connect in minutes. Query from one interface.
Everything you need.
Custom visualizations
Not limited to bar charts. The AI generates bespoke D3.js visualizations. Edit the code directly.
Pick your model
Model-agnostic AI. Choose the LLM that fits your needs — we're not locked to one provider.
Conversational exploration
Your analysis is a conversation. Ask follow-ups, upload files mid-thread, @mention previous results.
Interactive dashboards
Drag-and-drop grid. Date pickers, dropdowns, and text filters that flow through to queries in real time.
Team collaboration
Share workbooks with viewer/editor roles. Org-wide sharing. Public links with token-based access.
Version history
Every query, visualization, and dashboard is versioned. Restore any previous state with one click.
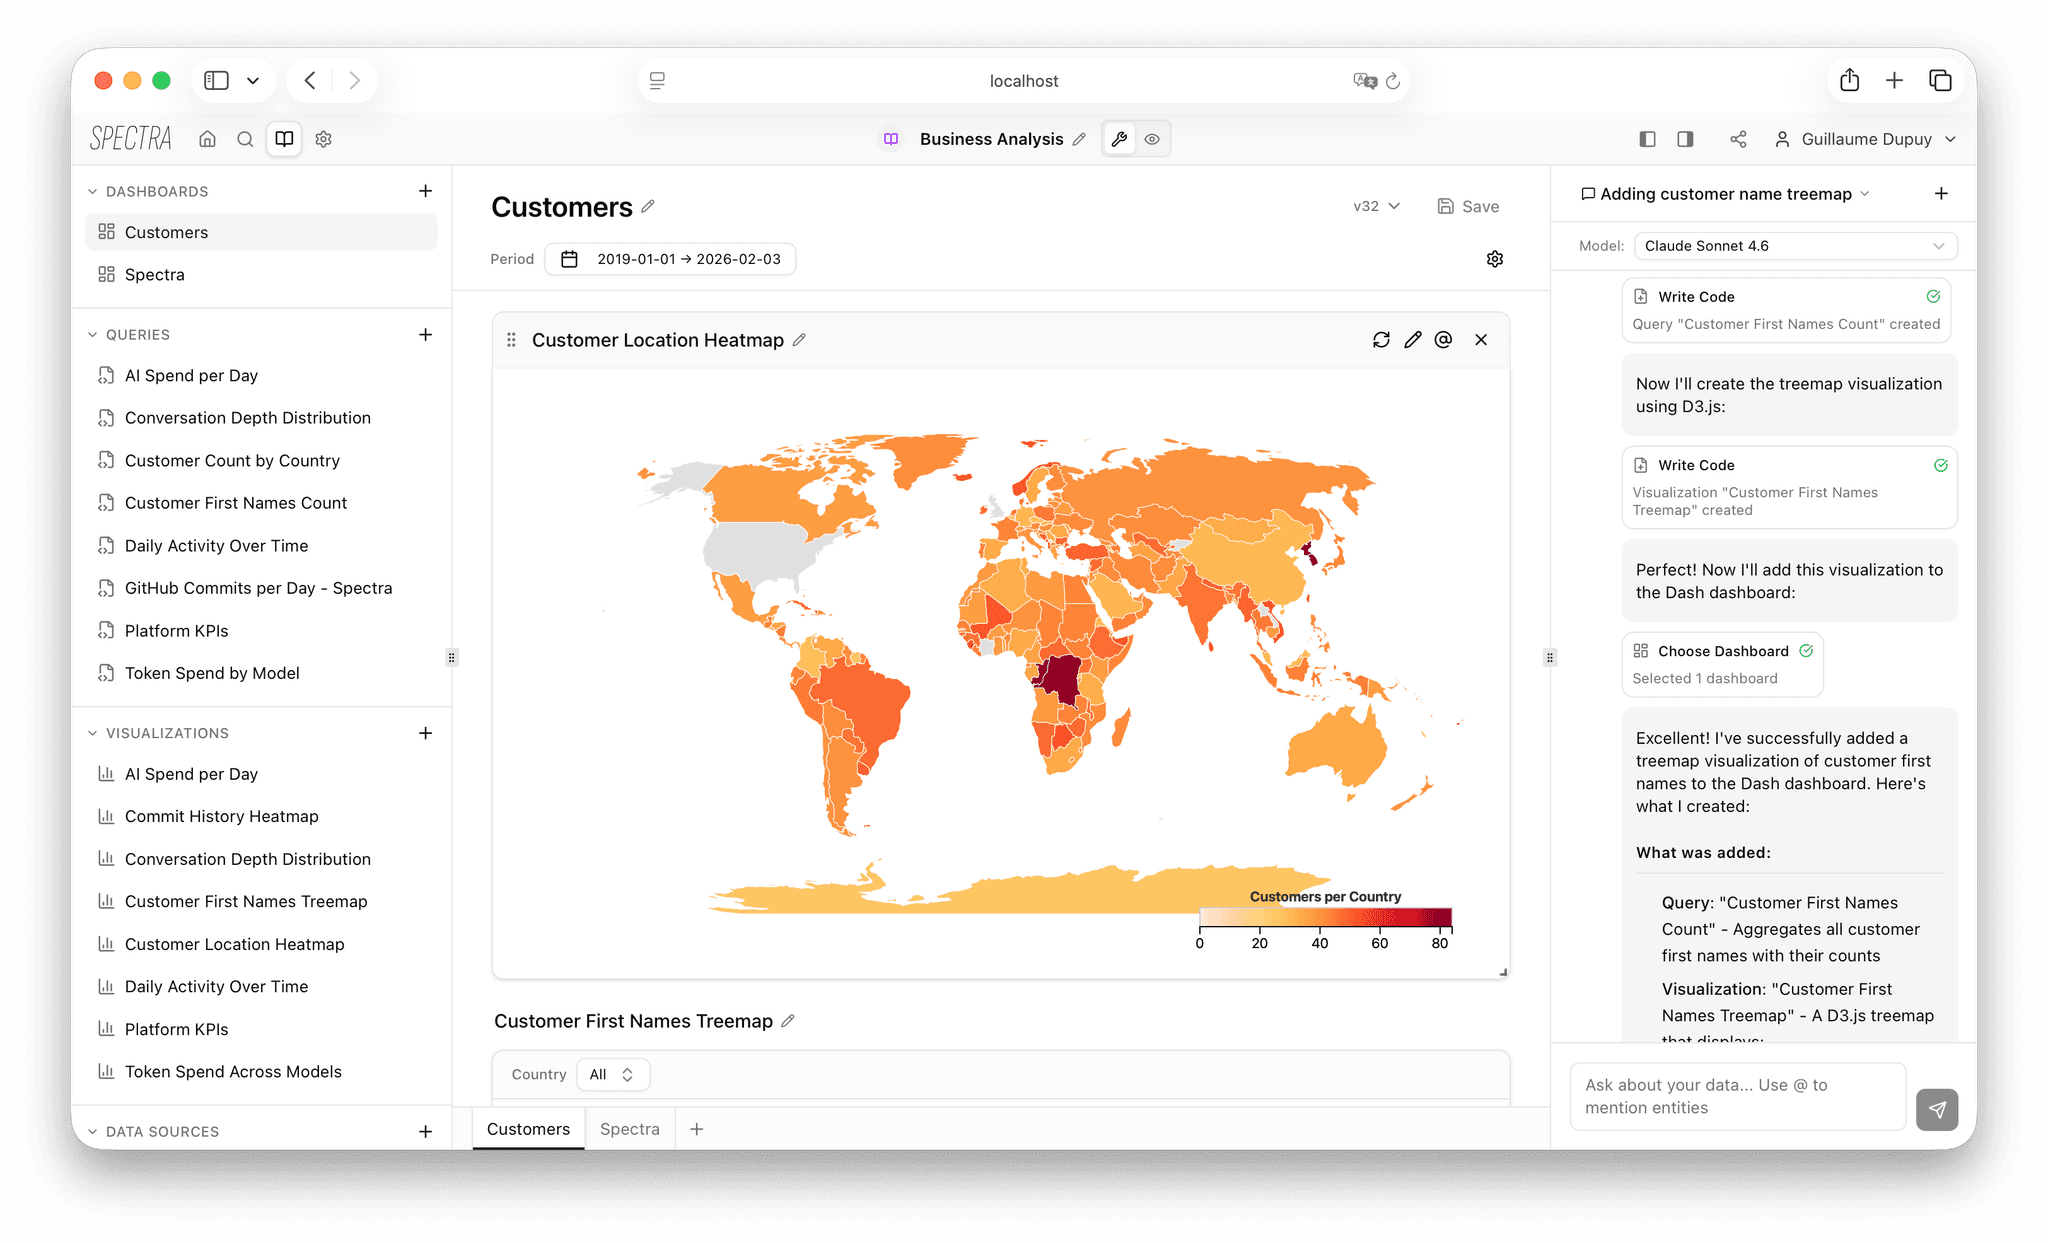
See it in action.
From question to visualization in seconds.
Here's the Monthly Revenue by Product Line chart. The query groups orders by month and product line, summing revenue. I used distinct colors for each line.
Simple pricing.
Team
—€ / editor / month
Includes token credits per editor. Viewers are free.
Overages billed at cost + 20%.
- Unlimited workbooks & dashboards
- Unlimited data source connections
- All visualization types
- Team sharing & collaboration
- Version history
- Pick your AI model
Built for your team.
Product teams
"How many users completed onboarding this week?" Answered in seconds, not support tickets.
Sales & ops
Build a pipeline dashboard from your CRM. No waiting on analysts.
Engineers
Drop a CSV of error logs. Find the pattern. Inspect the SQL. Edit the D3.